
Page 149 - AugDefComp
P. 149
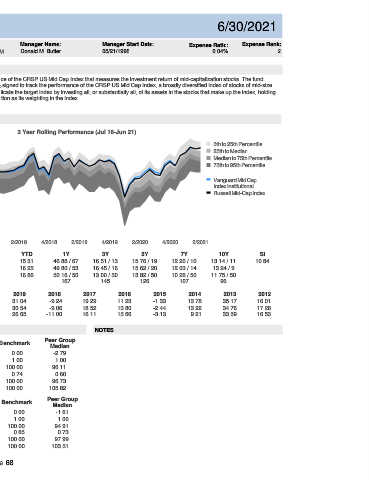
Vanguard Mid Cap Index Institutional  VMCIX                             6/30/2021


 Fund Incep Date:      Benchmark:     Category:     Net Assets:     Manager Name:    Manager Start Date:    Expense Ratio:  Expense Rank:
 05/21/1998  Russell Mid-Cap Index  Mid-Cap Blend   $154,083.00M   Donald M. Butler   05/21/1998  0.04%    2


 PORTFOLIO COMPOSITION (Holdings-based)     INVESTMENT OVERVIEW
  Assets  The investment seeks to track the performance of the CRSP US Mid Cap Index that measures the investment return of mid-capitalization stocks. The fund
 employs an indexing investment approach designed to track the performance of the CRSP US Mid Cap Index, a broadly diversified index of stocks of mid-size
    Cash  0.02%       U.S. companies. The advisor attempts to replicate the target index by investing all, or substantially all, of its assets in the stocks that make up the index, holding
    US Stocks  97.83%       each stock in approximately the same proportion as its weighting in the index.
    US Bonds  0.00%
    Non-US Stocks  2.15%
    Preferred Stocks  0.00%       PERFORMANCE
    Convertible Bonds  0.00%
    Other  0.00%       3 Year Rolling Performance (Jul 16-Jun 21)
    Non-US Bonds  0.00%       20
 Sector Breakdown                                                      5th to 25th Percentile
 Sensitive  15                                                         25th to Median
 Communication Services  5.61%                                         Median to 75th Percentile
 Industrials  11.92%  10                                               75th to 95th Percentile
 Technology  22.01%
 Energy  3.82%  5                                                      Vanguard Mid Cap
                                                                       Index Institutional
 Cyclical                                                              Russell Mid-Cap Index
 0
 Basic Materials  3.36%
 Consumer Cyclical  12.12%
 -5
 Real Estate  8.67%
 Financial Services  11.08%
 -10
 Defensive
 Consumer Defensive  3.25%  -15
 Healthcare  13.03%  4/2016  2/2017  4/2017  2/2018  4/2018  2/2019  4/2019  2/2020  4/2020  2/2021
 Utilities  5.12%
 3M     YTD          1Y           3Y           5Y           7Y           10Y          SI
 TOP 10 HOLDINGS
 Fund  7.58  15.31  46.88 / 67  16.51 / 13  15.76 / 19   12.20 / 10   13.14 / 11     10.84
 IDEXX Laboratories Inc  0.78%
 Benchmark  7.50  16.25  49.80 / 53  16.45 / 16  15.62 / 20  12.03 / 14  13.24 / 9
 DocuSign Inc  0.75%  Peer Group Median  5.36  16.86  50.16 / 50  13.00 / 50  13.82 / 50  10.26 / 50  11.75 / 50
 Marvell Technology Inc  0.68%
 Number of Funds     167          145          126          107          96
 IQVIA Holdings Inc  0.68%
 Chipotle Mexican Grill Inc  0.63%  CALENDAR  2020  2019  2018  2017  2016  2015  2014  2013  2012
 Veeva Systems Inc Class A  0.62%  Fund  18.26  31.04  -9.24  19.29  11.23  -1.33  13.78  35.17  16.01
 Aptiv PLC  0.62%  Benchmark  17.10  30.54  -9.06  18.52  13.80  -2.44  13.22  34.76  17.28
 Centene Corp  0.62%  Peer Group Median  12.79  26.65  -11.00  16.11  15.66  -3.13  9.21  33.59  16.53
 Digital Realty Trust Inc  0.62%
 Carrier Global Corp Ordinary Shares  0.61%
 RISK & PERFORMANCE STATISTICS   NOTES
 Total:  6.62%
                Peer Group
 3 Yr  Fund  Benchmark
 ASSET LOADINGS  (Returns-based)     Median
 Alpha  0.32  0.00  -2.79
 FUND EXPOSURES (WEIGHT) (Jul 18-Jun 21)  Beta  0.98  1.00  1.00
 100
 75  R-Squared  99.73  100.00  96.11
 Sharpe Ratio  0.76  0.74  0.60
 50
 25  Up Market Capture  97.76  100.00  96.73
 0  Down Market Capture  96.85  100.00  105.82
 Current       Average
 Fund  Bmk   Fund   Bmk   5 Yr  Fund  Benchmark  Peer Group
 Cash  1.0   0.3   0.4   0.1   Median
 Top Value  7.0   1.1   3.5   0.4   Alpha  0.41  0.00  -1.61
 Top Growth  0.4   0.0   4.0   0.2   Beta  0.98  1.00  1.00
 Mid Value  51.1   62.1   53.8   59.8   R-Squared  99.57  100.00  94.91
 Mid Growth  40.5   36.5   38.3   39.0   Sharpe Ratio  0.87  0.85  0.73
 Sm Value  0.0   0.0   0.0   0.2   Up Market Capture  97.98  100.00  97.99
 Sm Growth  0.0   0.0   0.0   0.4   Down Market Capture  95.90  100.00  103.51

 Page 68