Page 150 - AugDefComp
P. 150

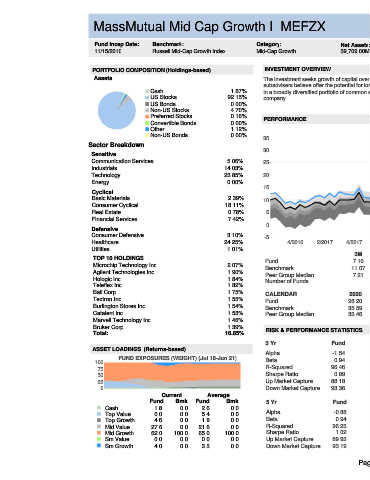
MassMutual Mid Cap Growth I                                  MEFZX                                                                                                 6/30/2021


                                Fund Incep Date:      Benchmark:                     Category:                   Net Assets:      Manager Name:              Manager Start Date:          Expense Ratio:   Expense Rank:
                                11/15/2010         Russell Mid-Cap Growth Index      Mid-Cap Growth              $9,709.00M       Brian W.H. Berghuis        05/31/2000                          0.71%                15


                               PORTFOLIO COMPOSITION (Holdings-based)                   INVESTMENT OVERVIEW
                                Assets                                                  The investment seeks growth of capital over the long-term. The fund invests primarily in equity securities of mid-capitalization companies that the fund's
                                                                                        subadvisers believe offer the potential for long-term growth. It invests at least 80% of its net assets (plus the amount of any borrowings for investment purposes)
                                                  Cash                       1.87%       in a broadly diversified portfolio of common stocks of mid-cap companies whose earnings the subadvisers expect to grow at a faster rate than the average
                                                  US Stocks                 92.15%       company.
                                                  US Bonds                   0.00%
                                                  Non-US Stocks              4.70%
                                                  Preferred Stocks           0.16%       PERFORMANCE
                                                  Convertible Bonds          0.00%
                                                  Other                      1.12%                                               3 Year Rolling Performance (Jul 16-Jun 21)
                                                  Non-US Bonds               0.00%       35
                              Sector Breakdown                                                                                                                                                5th to 25th Percentile
                                                                                        30                                                                                                    25th to Median
                               Sensitive
                               Communication Services                       5.06%       25                                                                                                    Median to 75th Percentile
                               Industrials                                 14.03%                                                                                                             75th to 95th Percentile
                               Technology                                  23.85%       20
                                                                                                                                                                                              MassMutual Mid Cap Growth I
                               Energy                                       0.00%
                                                                                        15                                                                                                    Russell Mid-Cap Growth Index
                               Cyclical
                               Basic Materials                              2.39%       10
                               Consumer Cyclical                           18.11%
                               Real Estate                                  0.78%        5
                               Financial Services                           7.42%
                                                                                         0
                               Defensive
                               Consumer Defensive                           3.10%       -5
                               Healthcare                                  24.25%               4/2016   2/2017    4/2017    2/2018    4/2018   2/2019    4/2019    2/2020    4/2020   2/2021
                               Utilities                                    1.01%
                                                                                                                      3M          YTD           1Y           3Y           5Y           7Y          10Y           SI
                               TOP 10 HOLDINGS
                                                                                        Fund                         7.10         9.98       40.16 / 77   19.33 / 59   18.34 / 67   14.86 / 47   14.95 / 35    15.58
                               Microchip Technology Inc                     2.07%
                                                                                        Benchmark                    11.07        10.44      43.77 / 59   22.39 / 33   20.52 / 39   15.39 / 34   15.13 / 30
                               Agilent Technologies Inc                     1.90%       Peer Group Median            7.21         9.88       45.17 / 50   20.68 / 50   19.80 / 50   14.70 / 50   14.22 / 50
                               Hologic Inc                                  1.84%
                                                                                        Number of Funds                                        187          174          161          151          139
                               Teleflex Inc                                 1.82%
                               Ball Corp                                    1.75%       CALENDAR                    2020       2019        2018        2017       2016        2015       2014        2013       2012
                               Textron Inc                                  1.55%       Fund                        26.20      32.22       -3.10      24.66       6.19        5.95       13.00       36.31      14.71
                               Burlington Stores Inc                        1.54%       Benchmark                   35.59      35.47       -4.75      25.27       7.33        -0.20      11.90       35.74      15.81
                               Catalent Inc                                 1.53%       Peer Group Median           33.46      32.68       -5.98      24.48       6.13        -0.76       7.39       35.73      14.36
                               Marvell Technology Inc                       1.46%
                               Bruker Corp                                  1.39%
                                                                                         RISK & PERFORMANCE STATISTICS                                     NOTES
                               Total:                                      16.85%
                                                                                                                                          Peer Group
                                                                                        3 Yr                  Fund         Benchmark
                               ASSET LOADINGS  (Returns-based)                                                                              Median
                                                                                        Alpha                 -1.54            0.00          -1.01
                                        FUND EXPOSURES (WEIGHT) (Jul 18-Jun 21)         Beta                   0.94            1.00           0.98
                                100
                                 75                                                     R-Squared             96.46          100.00         92.97
                                                                                        Sharpe Ratio           0.89            0.98           0.89
                                 50
                                 25                                                     Up Market Capture     88.18          100.00         97.03
                                  0                                                     Down Market Capture   93.36          100.00        100.39
                                                      Current        Average
                                                  Fund     Bmk   Fund      Bmk           5 Yr                  Fund         Benchmark      Peer Group
                                   Cash             1.8     0.0    2.6       0.0                                                             Median
                                   Top Value        0.0     0.0    5.4       0.0         Alpha                 -0.88            0.00         -0.16
                                   Top Growth       4.6     0.0    1.9       0.0         Beta                   0.94            1.00          0.99
                                   Mid Value       27.6     0.0   21.6       0.0         R-Squared             96.23          100.00         91.39
                                   Mid Growth      62.0   100.0   65.0     100.0         Sharpe Ratio           1.02            1.09          1.04
                                   Sm Value         0.0     0.0    0.0       0.0         Up Market Capture     89.93          100.00         97.17
                                   Sm Growth        4.0     0.0    3.5       0.0         Down Market Capture   93.19          100.00         99.81

                                                                                                                       Page 69
   145   146   147   148   149   150   151   152   153   154   155