
Page 154 - AugDefComp
P. 154
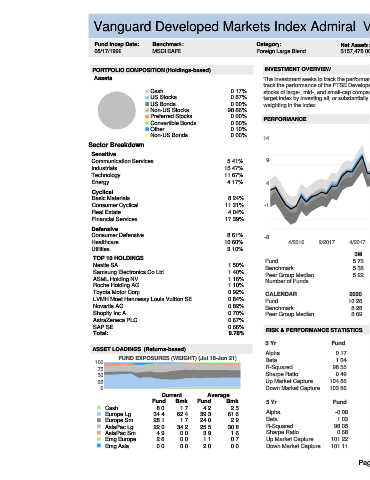
Vanguard Developed Markets Index Admiral VTMGX 6/30/2021
Fund Incep Date: Benchmark: Category: Net Assets: Manager Name: Manager Start Date: Expense Ratio: Expense Rank:
08/17/1999 MSCI EAFE Foreign Large Blend $157,478.00M Christine D. Franquin 02/22/2013 0.07% 5
PORTFOLIO COMPOSITION (Holdings-based) INVESTMENT OVERVIEW
Assets The investment seeks to track the performance of the FTSE Developed All Cap ex US Index. The fund employs an indexing investment approach designed to
track the performance of the FTSE Developed All Cap ex US Index, a market-capitalization-weighted index that is made up of approximately 3865 common
Cash 0.17% stocks of large-, mid-, and small-cap companies located in Canada and the major markets of Europe and the Pacific region. The adviser attempts to replicate the
US Stocks 0.87% target index by investing all, or substantially all, of its assets in the stocks that make up the index, holding each stock in approximately the same proportion as its
US Bonds 0.00% weighting in the index.
Non-US Stocks 98.86%
Preferred Stocks 0.00% PERFORMANCE
Convertible Bonds 0.00%
Other 0.10% 3 Year Rolling Performance (Jul 16-Jun 21)
Non-US Bonds 0.00% 14
Sector Breakdown 5th to 25th Percentile
25th to Median
Sensitive
Communication Services 5.41% 9 Median to 75th Percentile
75th to 95th Percentile
Industrials 15.47%
Technology 11.67%
Vanguard Developed
Energy 4.17% 4
Markets Index Admiral
Cyclical MSCI EAFE
Basic Materials 8.24%
Consumer Cyclical 11.31% -1
Real Estate 4.04%
Financial Services 17.39%
Defensive
Consumer Defensive 8.61% -8
Healthcare 10.60% 4/2016 2/2017 4/2017 2/2018 4/2018 2/2019 4/2019 2/2020 4/2020 2/2021
Utilities 3.10%
3M YTD 1Y 3Y 5Y 7Y 10Y SI
TOP 10 HOLDINGS
Fund 5.73 9.91 35.81 / 32 9.14 / 40 10.90 / 38 5.69 / 34 6.38 / 25 4.94
Nestle SA 1.50%
Benchmark 5.38 9.17 32.92 / 55 8.77 / 47 10.79 / 40 5.45 / 47 6.38 / 25
Samsung Electronics Co Ltd 1.40% Peer Group Median 5.22 9.12 33.55 / 50 8.63 / 50 10.37 / 50 5.37 / 50 5.89 / 50
ASML Holding NV 1.16%
Number of Funds 280 239 208 164 142
Roche Holding AG 1.10%
Toyota Motor Corp 0.92% CALENDAR 2020 2019 2018 2017 2016 2015 2014 2013 2012
LVMH Moet Hennessy Louis Vuitton SE 0.84% Fund 10.26 22.05 -14.46 26.40 2.45 -0.18 -5.66 22.06 18.56
Novartis AG 0.82% Benchmark 8.28 22.66 -13.36 25.62 1.51 -0.39 -4.48 23.29 17.90
Shopify Inc A 0.70% Peer Group Median 8.69 21.72 -14.39 25.44 1.20 -0.90 -5.33 20.20 18.14
AstraZeneca PLC 0.67%
SAP SE 0.66%
RISK & PERFORMANCE STATISTICS NOTES
Total: 9.78%
Peer Group
3 Yr Fund Benchmark
ASSET LOADINGS (Returns-based) Median
Alpha 0.17 0.00 0.00
FUND EXPOSURES (WEIGHT) (Jul 18-Jun 21) Beta 1.04 1.00 0.99
100
75 R-Squared 98.55 100.00 95.92
Sharpe Ratio 0.49 0.49 0.48
50
25 Up Market Capture 104.86 100.00 100.48
0 Down Market Capture 103.86 100.00 100.49
Current Average
Fund Bmk Fund Bmk 5 Yr Fund Benchmark Peer Group
Cash 8.0 1.7 4.2 2.5 Median
Europe Lg 34.4 62.4 39.3 61.6 Alpha -0.08 0.00 -0.36
Europe Sm 28.1 1.7 24.0 2.9 Beta 1.03 1.00 0.99
AsiaPac Lg 22.0 34.2 25.5 30.8 R-Squared 98.05 100.00 94.59
AsiaPac Sm 4.9 0.0 3.9 1.6 Sharpe Ratio 0.68 0.69 0.66
Emg Europe 2.6 0.0 1.1 0.7 Up Market Capture 101.22 100.00 98.46
Emg Asia 0.0 0.0 2.0 0.0 Down Market Capture 101.11 100.00 100.37
Page 71