Page 152 - AugDefComp
P. 152

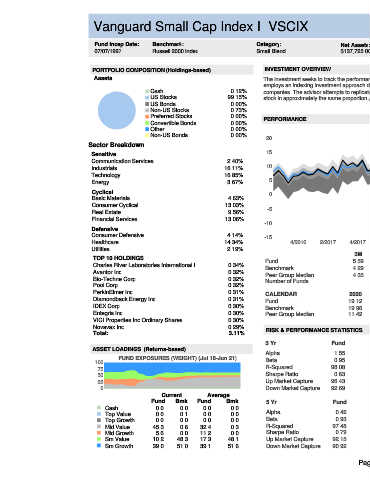
Vanguard Small Cap Index I                               VSCIX                                                                                                     6/30/2021


                                Fund Incep Date:      Benchmark:                     Category:                   Net Assets:      Manager Name:              Manager Start Date:          Expense Ratio:   Expense Rank:
                                07/07/1997         Russell 2000 Index                Small Blend                 $137,725.00M     William A. Coleman         04/27/2016                          0.04%                 2


                               PORTFOLIO COMPOSITION (Holdings-based)                   INVESTMENT OVERVIEW
                                Assets                                                  The investment seeks to track the performance of the CRSP US Small Cap Index that measures the investment return of small-capitalization stocks. The fund
                                                                                        employs an indexing investment approach designed to track the performance of the CRSP US Small Cap Index, a broadly diversified index of stocks of small U.S.
                                                  Cash                       0.12%       companies. The advisor attempts to replicate the target index by investing all, or substantially all, of its assets in the stocks that make up the index, holding each
                                                  US Stocks                 99.15%       stock in approximately the same proportion as its weighting in the index.
                                                  US Bonds                   0.00%
                                                  Non-US Stocks              0.73%
                                                  Preferred Stocks           0.00%       PERFORMANCE
                                                  Convertible Bonds          0.00%
                                                  Other                      0.00%                                               3 Year Rolling Performance (Jul 16-Jun 21)
                                                  Non-US Bonds               0.00%       20
                              Sector Breakdown                                                                                                                                                  5th to 25th Percentile
                               Sensitive                                                 15                                                                                                     25th to Median
                               Communication Services                       2.40%                                                                                                               Median to 75th Percentile
                               Industrials                                 16.11%        10                                                                                                     75th to 95th Percentile
                               Technology                                  16.85%
                               Energy                                       3.67%         5                                                                                                     Vanguard Small Cap Index I
                                                                                                                                                                                                Russell 2000 Index
                               Cyclical
                                                                                          0
                               Basic Materials                              4.63%
                               Consumer Cyclical                           13.03%
                                                                                         -5
                               Real Estate                                  9.56%
                               Financial Services                          13.06%
                                                                                        -10
                               Defensive
                               Consumer Defensive                           4.14%       -15
                               Healthcare                                  14.34%                4/2016    2/2017   4/2017    2/2018    4/2018    2/2019   4/2019    2/2020    4/2020    2/2021
                               Utilities                                    2.19%
                                                                                                                      3M          YTD           1Y           3Y           5Y           7Y          10Y           SI
                               TOP 10 HOLDINGS
                                                                                        Fund                         5.59         16.39      56.51 / 70   14.76 / 13   15.97 / 22   11.51 / 18   12.90 / 11     9.92
                               Charles River Laboratories International Inc  0.34%
                                                                                        Benchmark                    4.29         17.54      62.03 / 43   13.52 / 25   16.47 / 14   11.39 / 20   12.34 / 25
                               Avantor Inc                                  0.32%       Peer Group Median            4.35         19.72      60.82 / 50   11.76 / 50   14.39 / 50   10.12 / 50   11.50 / 50
                               Bio-Techne Corp                              0.32%
                                                                                        Number of Funds                                        246          225          199          179          152
                               Pool Corp                                    0.32%
                               PerkinElmer Inc                              0.31%       CALENDAR                    2020       2019        2018        2017       2016        2015       2014        2013       2012
                               Diamondback Energy Inc                       0.31%       Fund                        19.12      27.40       -9.32      16.25       18.32       -3.63       7.53       37.80      18.26
                               IDEX Corp                                    0.30%       Benchmark                   19.96      25.52      -11.01      14.65       21.31       -4.41       4.89       38.82      16.35
                               Entegris Inc                                 0.30%       Peer Group Median           11.42      23.91      -12.01      13.03       21.27       -4.43       4.76       38.47      15.98
                               VICI Properties Inc Ordinary Shares          0.30%
                               Novavax Inc                                  0.29%
                                                                                         RISK & PERFORMANCE STATISTICS                                     NOTES
                               Total:                                       3.11%
                                                                                                                                          Peer Group
                                                                                        3 Yr                  Fund         Benchmark
                               ASSET LOADINGS  (Returns-based)                                                                              Median
                                                                                        Alpha                  1.55            0.00          -1.11
                                        FUND EXPOSURES (WEIGHT) (Jul 18-Jun 21)         Beta                   0.95            1.00           0.98
                                100
                                 75                                                     R-Squared             98.08          100.00         95.92
                                                                                        Sharpe Ratio           0.63            0.57           0.52
                                 50
                                 25                                                     Up Market Capture     96.43          100.00         97.49
                                  0                                                     Down Market Capture   92.69          100.00        101.17
                                                      Current        Average
                                                   Fund    Bmk    Fund     Bmk           5 Yr                  Fund         Benchmark      Peer Group
                                   Cash             0.0     0.0     0.0      0.0                                                             Median
                                   Top Value        0.0     0.1     0.0      0.0         Alpha                  0.42            0.00          -1.36
                                   Top Growth       0.0     0.0     0.0      0.0         Beta                   0.93            1.00          0.99
                                   Mid Value       45.3     0.6    32.4      0.3         R-Squared             97.48          100.00         94.98
                                   Mid Growth       5.6     0.0    11.2      0.0         Sharpe Ratio           0.79            0.78          0.69
                                   Sm Value        10.2    48.3    17.3     48.1         Up Market Capture     92.15          100.00         94.91
                                   Sm Growth       39.0    51.0    39.1     51.6         Down Market Capture   90.92          100.00        101.74

                                                                                                                       Page 70
   147   148   149   150   151   152   153   154   155   156   157