
Page 158 - AugDefComp
P. 158
American Funds Capital World Gr&Inc R6 RWIGX 6/30/2021
Fund Incep Date: Benchmark: Category: Net Assets: Manager Name: Manager Start Date: Expense Ratio: Expense Rank:
05/01/2009 MSCI AC World Index Large Cap USD World Large-Stock Blend $124,126.00M Sung Lee 02/01/2006 0.42% 17
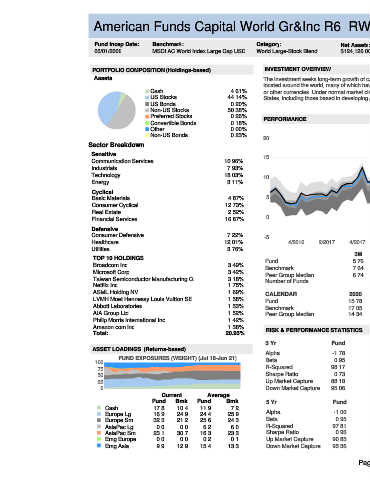
PORTFOLIO COMPOSITION (Holdings-based) INVESTMENT OVERVIEW
Assets The investment seeks long-term growth of capital while providing current income. The fund invests primarily in common stocks of well-established companies
located around the world, many of which have the potential to pay dividends. It invests, on a global basis, in common stocks that are denominated in U.S. dollars
Cash 4.61% or other currencies. Under normal market circumstances, the fund will invest a significant portion of its assets in securities of issuers domiciled outside the United
US Stocks 44.14% States, including those based in developing countries.
US Bonds 0.20%
Non-US Stocks 50.38%
Preferred Stocks 0.26% PERFORMANCE
Convertible Bonds 0.18%
Other 0.00% 3 Year Rolling Performance (Jul 16-Jun 21)
Non-US Bonds 0.23% 20
Sector Breakdown 5th to 25th Percentile
25th to Median
Sensitive 15
Communication Services 10.96% Median to 75th Percentile
75th to 95th Percentile
Industrials 7.93%
Technology 18.03%
10 American Funds
Energy 3.11%
Capital World Gr&Inc R6
Cyclical MSCI AC World
Basic Materials 4.87% 5 Index Large Cap USD
Consumer Cyclical 12.73%
Real Estate 2.52%
Financial Services 16.87% 0
Defensive
Consumer Defensive 7.22% -5
Healthcare 12.01% 4/2016 2/2017 4/2017 2/2018 4/2018 2/2019 4/2019 2/2020 4/2020 2/2021
Utilities 3.76%
3M YTD 1Y 3Y 5Y 7Y 10Y SI
TOP 10 HOLDINGS
Fund 5.76 10.49 35.65 / 66 12.91 / 55 13.71 / 43 9.31 / 48 10.07 / 46 12.07
Broadcom Inc 3.49%
Benchmark 7.64 12.51 38.98 / 46 15.59 / 14 15.50 / 12 10.52 / 17 10.63 / 24
Microsoft Corp 3.42% Peer Group Median 6.74 12.28 38.23 / 50 13.47 / 50 13.39 / 50 9.27 / 50 9.68 / 50
Taiwan Semiconductor Manufacturing Co Ltd 3.18%
Number of Funds 117 103 90 74 54
Netflix Inc 1.75%
ASML Holding NV 1.69% CALENDAR 2020 2019 2018 2017 2016 2015 2014 2013 2012
LVMH Moet Hennessy Louis Vuitton SE 1.58% Fund 15.78 25.74 -9.97 25.08 6.85 -1.88 4.36 25.28 19.56
Abbott Laboratories 1.53% Benchmark 17.05 27.44 -8.12 24.55 8.66 -1.97 4.69 23.15 16.68
AIA Group Ltd 1.52% Peer Group Median 14.34 26.22 -9.66 23.02 6.63 -1.04 4.02 25.37 15.17
Philip Morris International Inc 1.42%
Amazon.com Inc 1.38%
RISK & PERFORMANCE STATISTICS NOTES
Total: 20.95%
Peer Group
3 Yr Fund Benchmark
ASSET LOADINGS (Returns-based) Median
Alpha -1.78 0.00 -2.03
FUND EXPOSURES (WEIGHT) (Jul 18-Jun 21) Beta 0.95 1.00 1.02
100
75 R-Squared 98.17 100.00 96.48
Sharpe Ratio 0.73 0.84 0.71
50
25 Up Market Capture 88.18 100.00 95.37
0 Down Market Capture 95.06 100.00 102.58
Current Average
Fund Bmk Fund Bmk 5 Yr Fund Benchmark Peer Group
Cash 17.8 10.4 11.9 7.2 Median
Europe Lg 16.9 24.9 24.4 25.9 Alpha -1.00 0.00 -1.86
Europe Sm 32.3 21.2 25.6 24.3 Beta 0.95 1.00 1.01
AsiaPac Lg 0.0 0.0 6.2 6.0 R-Squared 97.81 100.00 95.31
AsiaPac Sm 23.1 30.7 16.3 23.3 Sharpe Ratio 0.93 1.01 0.86
Emg Europe 0.0 0.0 0.2 0.1 Up Market Capture 90.85 100.00 93.86
Emg Asia 9.9 12.9 15.4 13.3 Down Market Capture 95.36 100.00 103.12
Page 73