
Page 157 - AugDefComp
P. 157
American Funds Europacific Growth R6 RERGX 6/30/2021
Fund Incep Date: Benchmark: Category: Net Assets: Manager Name: Manager Start Date: Expense Ratio: Expense Rank:
05/01/2009 MSCI EAFE Growth Foreign Large Growth $196,361.00M Carl M. Kawaja 06/01/2001 0.46% 9
PORTFOLIO COMPOSITION (Holdings-based) INVESTMENT OVERVIEW
Assets The investment seeks long-term growth of capital. The fund invests primarily in common stocks of issuers in Europe and the Pacific Basin that the investment
adviser believes have the potential for growth. Growth stocks are stocks that the investment adviser believes have the potential for above-average capital
Cash 3.57% appreciation. It normally will invest at least 80% of its net assets in securities of issuers in Europe and the Pacific Basin. The fund may invest a portion of its
US Stocks 0.94% assets in common stocks and other securities of companies in emerging markets.
US Bonds 0.05%
Non-US Stocks 95.31%
Preferred Stocks 0.00% PERFORMANCE
Convertible Bonds 0.00%
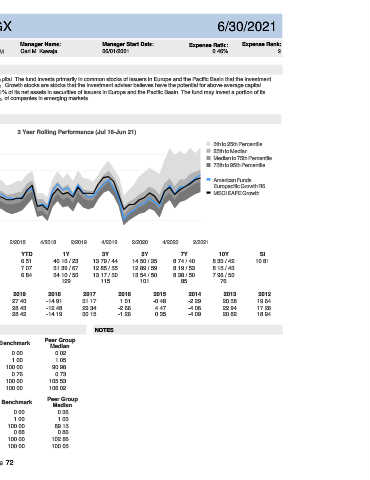
Other 0.13% 3 Year Rolling Performance (Jul 16-Jun 21)
Non-US Bonds 0.00% 25
Sector Breakdown 5th to 25th Percentile
25th to Median
Sensitive 20
Communication Services 7.52% Median to 75th Percentile
75th to 95th Percentile
Industrials 9.81%
15
Technology 18.37%
American Funds
Energy 5.58%
10 Europacific Growth R6
Cyclical MSCI EAFE Growth
Basic Materials 8.05%
Consumer Cyclical 13.12% 5
Real Estate 0.77%
Financial Services 16.28% 0
Defensive
Consumer Defensive 4.97% -5
Healthcare 12.96% 4/2016 2/2017 4/2017 2/2018 4/2018 2/2019 4/2019 2/2020 4/2020 2/2021
Utilities 2.57%
3M YTD 1Y 3Y 5Y 7Y 10Y SI
TOP 10 HOLDINGS
Fund 6.97 6.51 40.10 / 23 13.79 / 44 14.50 / 35 8.74 / 40 8.33 / 42 10.81
ASML Holding NV 3.40%
Benchmark 7.59 7.07 31.39 / 67 12.85 / 55 12.89 / 59 8.19 / 53 8.15 / 43
Taiwan Semiconductor Manufacturing Co Ltd 2.28% Peer Group Median 6.78 6.84 34.10 / 50 13.17 / 50 13.54 / 50 8.38 / 50 7.96 / 50
AIA Group Ltd 2.22%
Number of Funds 129 115 101 85 76
Reliance Industries Ltd Shs Dematerialised 2.19%
MercadoLibre Inc 2.09% CALENDAR 2020 2019 2018 2017 2016 2015 2014 2013 2012
LVMH Moet Hennessy Louis Vuitton SE 2.09% Fund 25.27 27.40 -14.91 31.17 1.01 -0.48 -2.29 20.58 19.64
Vale SA ADR 1.91% Benchmark 18.68 28.43 -12.48 29.34 -2.66 4.47 -4.06 22.94 17.28
Sea Ltd ADR 1.87% Peer Group Median 21.88 28.42 -14.19 30.15 -1.26 0.35 -4.09 20.82 18.94
Airbus SE 1.69%
1.60%
WuXi Biologics (Cayman) Inc Registered Shs Unitary 144A/Reg S
RISK & PERFORMANCE STATISTICS NOTES
Total: 21.35%
Peer Group
3 Yr Fund Benchmark
ASSET LOADINGS (Returns-based) Median
Alpha -0.18 0.00 0.02
FUND EXPOSURES (WEIGHT) (Jul 18-Jun 21) Beta 1.12 1.00 1.05
100
75 R-Squared 91.46 100.00 90.98
Sharpe Ratio 0.72 0.76 0.73
50
25 Up Market Capture 115.21 100.00 105.53
0 Down Market Capture 116.42 100.00 106.02
Current Average
Fund Bmk Fund Bmk 5 Yr Fund Benchmark Peer Group
Cash 4.2 21.1 1.7 15.6 Median
Europe Lg 8.2 43.6 20.0 43.7 Alpha 0.77 0.00 0.36
Europe Sm 28.9 5.3 26.3 9.3 Beta 1.08 1.00 1.03
AsiaPac Lg 8.0 0.0 7.7 1.7 R-Squared 89.06 100.00 89.15
AsiaPac Sm 16.5 26.6 10.9 25.5 Sharpe Ratio 0.88 0.88 0.86
Emg Europe 6.2 3.5 4.0 1.3 Up Market Capture 108.53 100.00 102.86
Emg Asia 28.2 0.0 29.4 2.9 Down Market Capture 103.18 100.00 100.05
Page 72