Page 54 - NovDefComp
P. 54

Q3 2020 Market Review – U.S. Equity
                                        Q3 2020 Market Review - U.S. Equity


                                     U.S. EQUITY

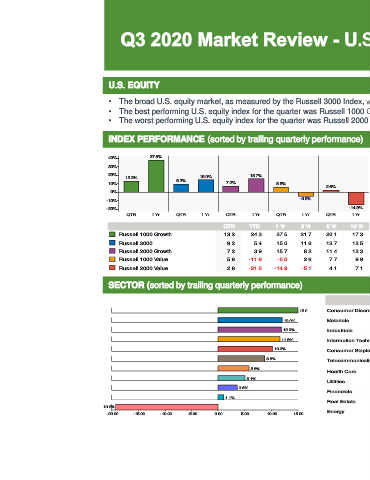
                                     •  The broad U.S. equity market, as measured by the Russell 3000 Index, was up 9.2% for the quarter.
                                     •  The best performing U.S. equity index for the quarter was Russell 1000 Growth, returning a positive 13.2%.
                                     •  The worst performing U.S. equity index for the quarter was Russell 2000 Value, returning a positive 2.6%.


                                     INDEX PERFORMANCE (sorted by trailing quarterly performance)                              GROWTH VS. VALUE

                                                                                                                              50%                                  Grow th Outperforms
                                     40%          37.5%
                                                                                                                              40%
                                     30%
                                                                                                                              30%
                                     20%                                            15.7%
                                          13.2%                    15.0%                                                      20%
                                     10%                   9.2%             7.2%            5.6%                              10%
                                                                                                             2.6%
                                     0%                                                                                        0%
                                    -10%                                                            -5.0%                     10%
                                    -20%                                                                            -14.9%    20%                                  Value Outperforms
                                           QTR     1 Yr    QTR     1 Yr     QTR     1 Yr    QTR     1 Yr     QTR     1 Yr        2008   2009  2010   2011   2012   2013  2014   2015   2016   2017   2018  2019
                                                                           QTR     YTD      1 Yr    3 Yr     5 Yr    10 Yr     Over the last year, growth stocks outperformed value stocks by 42.5%.
                                        Russell 1000 Growth                13.2     24.3    37.5    21.7     20.1    17.3      For the trailing quarter, growth stocks outperformed value stocks by 7.6%.
                                        Russell 3000                        9.2      5.4    15.0    11.6     13.7    13.5
                                        Russell 2000 Growth                 7.2      3.9    15.7     8.2     11.4    12.3      The graph above is plotted using a rolling one-year time period. Growth stock
                                        Russell 1000 Value                  5.6    -11.6     -5.0    2.6      7.7     9.9      performance is represented by the Russell 1000 Growth Index. Value stock
                                        Russell 2000 Value                  2.6    -21.5    -14.9    -5.1     4.1     7.1      performance is represented by the Russell 1000 Value Index.

                                     SECTOR (sorted by trailing quarterly performance)


                                                                                                                                                              QTR      YTD       1 Yr     3 Yr      5 Yr     10 Yr
                                                                                                    15.0%    Consumer Discretionary                           15.0     21.2      27.0     18.8      15.9     17.4
                                                                                              12.0%          Materials                                        12.0      2.7       9.3      4.5      11.6      9.3
                                                                                              12.0%          Industrials                                      12.0      -4.4      1.2      4.5      11.0     11.8
                                                                                              11.6%          Information Technology                           11.6     26.9      44.9     27.0      26.5     20.0
                                                                                           10.3%
                                                                                                             Consumer Staples                                 10.3      4.1       7.9      8.9       9.3     11.8
                                                                                         8.8%
                                                                                                             Telecommunication Svcs.                           8.8      8.2      17.8      9.2      10.5      9.3
                                                                                   5.8%
                                                                                                             Health Care                                       5.8      5.2      20.1     11.3      12.1     15.7
                                                                                  5.1%
                                                                                                             Utilities                                         5.1      -7.5     -7.1      6.7      10.2     10.7
                                                                                3.6%
                                                                                                             Financials                                        3.6     -21.1    -13.2      -0.8      7.4      9.5
                                                                           1.1%
                                                                                                             Real Estate                                       1.1     -11.6    -11.4      4.0       6.7      9.5
                                  -19.2%
                                                                                                             Energy                                          -19.2     -48.5    -45.5     -21.4    -10.7      -3.9
                                    -20.00   -15.00   -10.00   -5.00    0.00    5.00     10.00    15.00
                                                                                                                                                                                Source: S&P 1500 Sector Indices


                                                                                                                                                                                                                       5
   49   50   51   52   53   54   55   56   57   58   59